Final-year & 12th-pass learners
Get an early start alongside college, as long as you are ready to practise regularly.


Collect, clean, analyse and present business data with Excel, SQL, Power BI, Tableau and Python — on real datasets and hands-on projects.
Program snapshot
Data Analytics · Beginner
Same trainers and live projects on every track. Pick the length that fits your semester or career plan — a counsellor shares fees and scholarships.
3months
Core skills and guided projects for students on a short timeline or professionals upskilling.
6months
University-approved industrial training with a live project, training report and internship letter.
9months
Everything in the 6-month track plus advanced modules and an internship on real client work.
Every business runs on numbers, and people who can turn raw data into clear decisions are in demand across industries. This training teaches you to collect, clean, analyse and present data with the tools employers ask for: Excel, SQL, Power BI, Tableau and Python.
The curriculum follows the way analysts actually work: get the data, clean it, analyse it, visualise it and explain it. You learn on real datasets rather than theory alone, each module ends with a practical task, and you finish with dashboards and reports you can show in interviews.
Included on every track.
Who can join: 12th pass or graduate, any stream — comfort with basic maths helps.
3 phases, each ending in work you can show. Tap a phase or use the arrow keys to explore.
Phase 1 of 3
Learn how analysts frame a business question, then build the spreadsheet and query skills they use every day.
By the end: You can clean a spreadsheet, summarise it and write SQL queries that answer business questions.
Phase 2 of 3
Read numbers correctly so you do not draw wrong conclusions, then use Python to explore larger and messier datasets.
By the end: You can interpret statistics sensibly and explore a messy dataset in Python.
Phase 3 of 3
Build interactive dashboards and complete an end-to-end business case study you can present.
By the end: You can run an end-to-end analysis, build a dashboard and explain what it means to non-technical people.
Analytics is useful in almost every industry, so these skills make you better at a current role in sales, finance, HR, operations or marketing and open a path into analyst work, with data science as a later step.
12th pass or graduate, any stream — comfort with basic maths helps.
Get an early start alongside college, as long as you are ready to practise regularly.
Any stream, from commerce to engineering, wanting a skill valued across industries.
Decide from data instead of guesswork in sales, finance, operations, HR or marketing.
Track sales, inventory and customer trends on your own dashboards.
A structured path from non-technical or support roles into analytics.
Offer reporting, dashboard and data-cleaning services to clients.
You install, configure and ship with every one of these in the lab — the stack employers expect on day one.
Cleaning, formulas & pivot analysis
Spreadsheet analysis & sharing
Querying relational databases
Exploring & analysing datasets
Data handling in Python
Charts for exploratory analysis
Dashboards, data modelling & DAX basics
Interactive visual reports
Practice environment for analysis
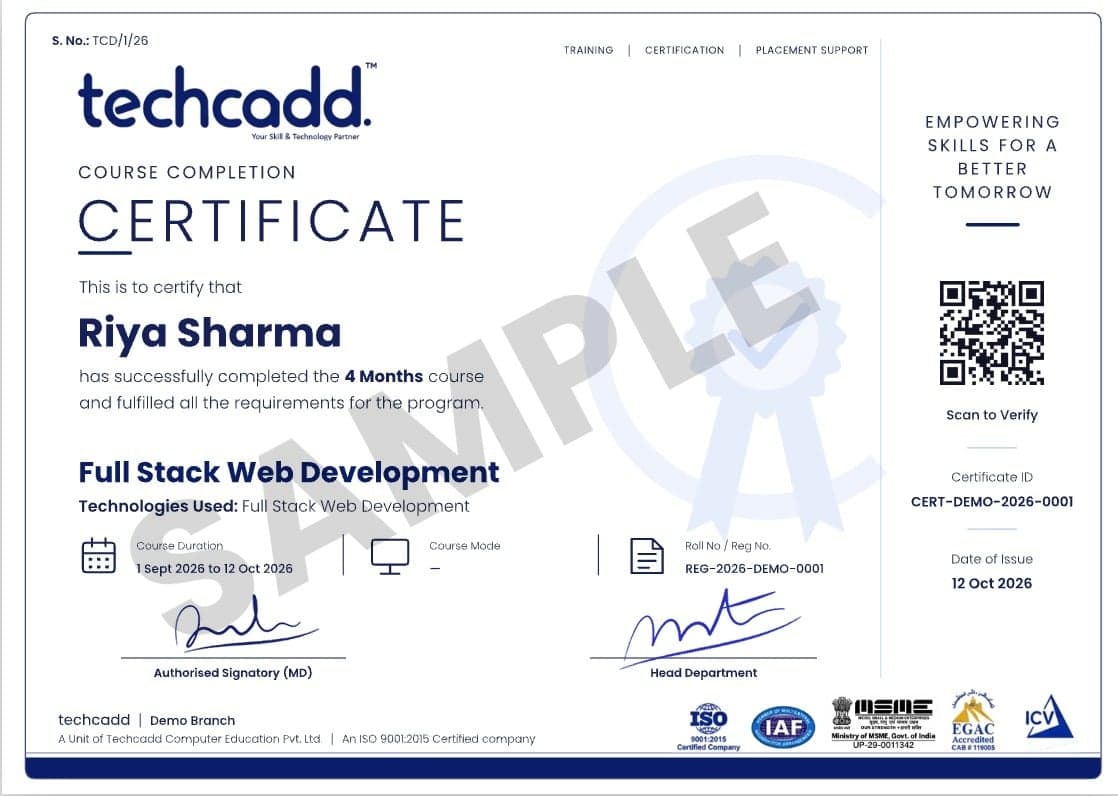
Industry recognised
QR-verifiable certificate with your course, duration, registration number and certificate ID.
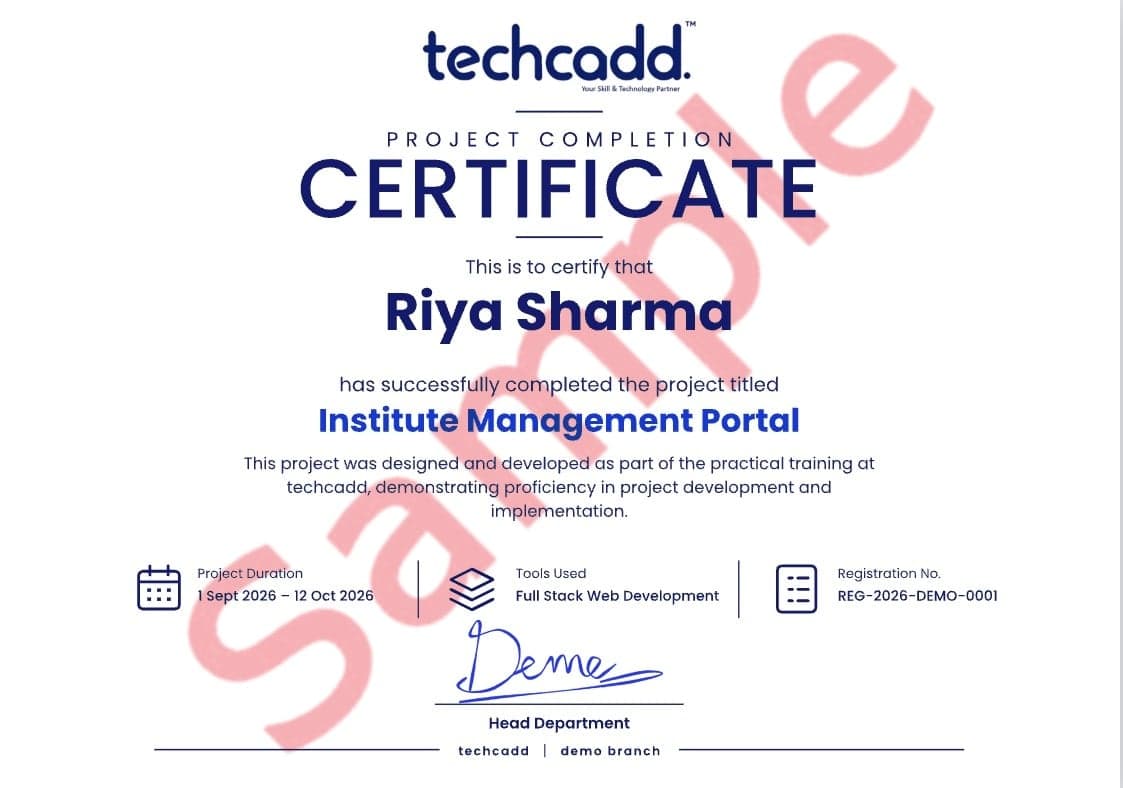
Live project
Names the live project you built, its tools and dates — issued with your internship letter for university training credit.
Every certificate has a unique number that anyone can verify on techcaddjalandhar.com.
Online-verifiable certificate listing your modules, projects and grade.
Experience letter for your live-project internship, accepted for university credit.
Four reviewed projects on GitHub or Behance that you can walk an interviewer through.
Resume and portfolio review, mock interviews and referrals until you are hired.
Straight answers to the career questions students ask us most.
Data Analyst, Business Analyst, MIS Executive, Reporting Analyst, BI Analyst, Marketing Analyst and Operations Analyst are the roles this training prepares you for.
Over time many analysts move towards senior analyst or analytics manager roles, or build further technical depth for data engineering or data science.
Yes. Common services are data cleaning, Excel automation, dashboard building and monthly reporting for small businesses and online clients. Strong portfolio projects help you win your first clients.
In Punjab, manufacturing, hosiery, sports goods and export units need analysts for production, cost and sales reporting, and Mohali’s IT and startup space hires for reporting roles. Elsewhere in North India, logistics, automobile, e-commerce, fintech, retail and BPO employers hire for MIS, operations and marketing analytics, and remote analyst roles are open too.
Go deeper into SQL, Power BI or Python, then consider data science or data engineering, depending on where you want your technical depth to grow.
Each project is reviewed by a trainer and published to your portfolio before you move on.
Clean a raw sales sheet, build pivot summaries and charts, and turn them into a one-page KPI dashboard.
Query a relational database with joins, aggregates and window functions to answer sales and inventory questions and prepare the data for reporting.
Take a brief on sales, marketing, HR, finance or operations data, model it and build an interactive dashboard with clear KPIs.
Clean and explore a dataset in Python, visualise the findings and present recommendations in plain language.
Repeated for every module, so the job feels familiar before you get it.
Every task starts like a real job: a brief, a deadline and a clear definition of done.
You build it yourself in the lab while a mentor reviews your work and unblocks you.
Demo your work and answer questions — practice for interviews and client calls.
Mentors who still ship real projects for clients.
Real briefs, not copy-paste sample projects.
Personal attention and same-day doubt clearing.
Longer tracks include an internship and experience letter.
Resume, mock interviews and referrals to 500+ partners.
Nearly two decades of training students across North India.
What changes when training is built around live work.
| What matters | TechCADD | Typical institute |
|---|---|---|
| Training style | Hands-on labs every class | Mostly theory & slides |
| Projects | Live client briefs & capstone | Sample projects only |
| Batch size | Small batches | Large classrooms |
| Trainer background | Working industry professionals | Full-time trainers only |
| Internship | Included in longer tracks | Rarely offered |
| Placement support | Resume, mock interviews & referrals | Job list on request |
| Doubt clearing | Same day, 1:1 if needed | Weekly, if at all |
| Certification | Verifiable certificate + internship letter | Paper certificate |
Data analytics is one of the few skills that is useful in almost every industry. Banks, hospitals, retailers, schools, logistics firms and startups all collect data, and most of them struggle to understand it. That gap is why analyst roles keep appearing in job listings across India, from Bengaluru, Hyderabad, Pune and Mumbai to growing hubs like Gurugram and Noida.
01
Companies increasingly expect decisions to be backed by numbers. Roles such as Data Analyst, Business Analyst, MIS Executive, Reporting Analyst, BI Developer and Marketing Analyst are common entry points. Many of these roles are also open to remote work, which is useful if you live outside a metro.
02
Unlike some technical fields, you can begin data analytics without a coding background. The learning path moves from Excel to SQL to visualisation tools, and then to Python for those who want to go deeper. Each step produces something you can actually use at work, so the skill pays off even before you finish the course.
03
If you work in sales, finance, HR, operations or marketing, analytics makes you better at your current job and opens a path to a promotion or a role change. Freelancers can offer dashboards, data cleaning and reporting as paid services. Business owners can use the same skills to track sales, costs and customer behaviour without depending on someone else.
04
This data analytics course focuses on practice rather than theory. You work on real datasets, build dashboards and prepare reports the way analysts do on the job, so you finish with projects you can discuss in interviews. Live online classes also mean you can learn from anywhere in North India without changing cities.
05
06
If you are comparing options, look beyond the course title. Check the tools taught, the number of projects, who trains you and how much hands-on practice you get. A good data analytics course should leave you able to open a messy dataset, clean it, analyse it and explain what it means in plain language.
Our live online classes let you learn from wherever you are. Here is how learners from different states can use this skill:
Manufacturing, hosiery, sports goods and export businesses generate heavy sales and inventory data. A data analytics course in Punjab helps local professionals and business owners turn that data into better decisions.
With MNCs, logistics and e-commerce in the region, learners in Haryana can aim for analyst roles in supply chain, operations and customer reporting.
Online data analytics training suits Himachal Pradesh students who want remote jobs or freelancing without moving to a metro, and tourism or hotel professionals who track bookings and seasonal demand.
The tricity's IT, BPO and startup ecosystem offers entry points for freshers who can show strong Excel, SQL and dashboard skills.
As the largest fresher job market, Delhi NCR has agencies, fintech and e-commerce companies that regularly hire analysts, so portfolio projects matter most here.
Hospitality, tourism and pharma units in the state need people who can read occupancy, production and sales numbers.
Jewellery, textile and handicraft businesses can use data to forecast demand, and tourism players can study visitor patterns.
Retail, electronics and IT hubs create steady demand for MIS and reporting skills, and government-sector aspirants can add a practical data skill to their profile.
4.9750+ Google reviews
Switch modes if your schedule changes — your projects and progress move with you.
Lab-based batches at our North India branches.
Interactive live sessions with recordings for revision.
Saturday–Sunday batches for college students and working people.
Personal mentoring at your pace and schedule.
23 questions
No. SQL and Python are taught from the basics, and the early modules rely on Excel and visual tools. You only need to be comfortable with basic computer use and curious about numbers.
A laptop or desktop, a stable internet connection if you learn online, and willingness to practise on real datasets.
Excel, Google Sheets, SQL, Python with Pandas, NumPy, Matplotlib and Seaborn, Power BI, Tableau and Jupyter Notebook — tools commonly asked for in analyst job listings.
Either. Live online classes and classroom learning at the Jalandhar centre are both available, so you can pick what suits your schedule and location.
Data analytics mainly studies past data to explain what happened, while data science goes further and builds models to predict what may happen next. In practice the two overlap, and analytics needs no coding background to begin.
A data analytics course teaches you to collect, clean, analyse and present data so businesses can make better decisions. At Techcadd, it covers Excel, SQL, statistics, Python, Power BI and Tableau, with hands-on projects.
Any graduate, postgraduate, working professional, job switcher, freelancer or business owner can join, and no technical background is required. Final-year students and 12th-pass learners can also enrol if they are ready to practise regularly.
Yes, beginners can learn data analytics because the course starts from the fundamentals. You begin with Excel and basic statistics, then move step by step to SQL, visualisation tools and Python.
No, you do not need prior coding knowledge. SQL and Python are taught from the basics, and the early modules rely on Excel and visual tools.
The syllabus covers data analytics foundations, advanced Excel, SQL, statistics, Python with Pandas and NumPy, Power BI and Tableau, and a capstone project. The detailed module list is in the "What You Will Learn" section above.
You will learn Excel, Google Sheets, SQL, Python (Pandas, NumPy, Matplotlib, Seaborn), Power BI, Tableau and Jupyter Notebook. These are among the tools most commonly asked for in analyst job listings.
Yes, learners receive a Techcadd course completion certificate after finishing the program. Employers also look at your projects and your ability to explain your work, so the portfolio you build matters as much as the certificate.
You can choose either. Techcadd offers live online classes as well as offline learning at its Jalandhar centre, so you can pick what suits your schedule and location.
You can apply for roles such as Data Analyst, Business Analyst, MIS Executive, Reporting Analyst, BI Analyst and Marketing Analyst. Freelancing in dashboards and reporting is another option.
Yes, many learners offer services such as data cleaning, Excel automation, dashboard building and monthly reporting to small businesses and online clients. Strong portfolio projects help you win your first clients.
Yes, it suits professionals in sales, finance, HR, operations and marketing because you can apply the skills in your current job or use them to move into an analyst role. Live online classes make it easier to learn alongside work.
Yes, students from Himachal Pradesh can join through live online classes from places like Shimla, Solan or Dharamshala. This also suits learners who want remote jobs or freelancing without moving to a metro.
In Punjab, manufacturing, hosiery, export and IT companies in Mohali need reporting and sales analysts. In Haryana, logistics, automobile and e-commerce firms hire for operations and customer analytics roles.
Yes, learners from Jammu & Kashmir and Uttarakhand can attend live online sessions and practise on the same projects as other students. Local tourism, hospitality, handicraft and pharma businesses also use data skills, so the course helps both job seekers and business owners.
Yes, the skills apply across both states. Rajasthan's tourism, jewellery and textile sectors use data for demand planning, and Uttar Pradesh's retail, electronics and IT sectors need MIS and reporting professionals.
No institute can honestly guarantee a job. We provide placement assistance — resume and portfolio reviews, mock interviews and referrals to 500+ hiring partners — and keep supporting you until you are placed.
Book a free counselling session or message us on WhatsApp. A counsellor will share the current fee, EMI options and scholarships for your chosen track.
Yes. Book a free demo using the form on this page or call us. You can attend at any branch or join a live online class.
Sit in a free demo class or talk to a counsellor about your background and goals — no obligation.
Tell us a little about yourself — we'll suggest the right track, share fee and scholarship details and book your free demo.
2nd Floor, Crystal Plaza, SCS 78, Opposite PIMS Hospital, Jalandhar, Punjab 144001Mon – Sat: 9:00 AM – 7:00 PM